

According to a 2018 paper released by the Economic Policy Institute, a nonprofit, nonpartisan think tank in
Question:
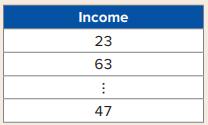
According to a 2018 paper released by the Economic Policy Institute, a nonprofit, nonpartisan think tank in Washington, D.C., income inequality continues to grow in the United States. Over the years, the rich have become richer while working-class wages have stagnated. A local Latino politician has been vocal regarding his concern about the welfare of Latinx. In various speeches, he has stated that the mean salary of Latinx households in his county has fallen below the 2017 mean of approximately $50,000. He has also stated that the proportion of Latinx households making less than $30,000 has risen above the 2017 level of 20%. Both of his statements are based on income data for 36 Latinx households in the county. A portion of the data is shown in Table 5.6.
TABLE 5.6 Latinx Household Income (in $1,000s)
Trevor Jones is a newspaper reporter who is interested in verifying the concerns of the local politician. Trevor wants to use the sample information to
1. Determine if the mean income of Latinx households has fallen below the 2017 level of $50,000.
2. Determine if the percentage of Latinx households making less than $30,000 has risen above 20%.
One of the hotly debated topics in the United States is that of growing income inequality. This trend, which has picked up post Great Recession, is a reversal of what was seen during and after the Great Depression, where the gap between rich and poor narrowed. Market forces such as increased trade and technological advances have made highly skilled and well-educated workers more productive, thus increasing their pay. Institutional forces, such as deregulation, the decline of unions, and the stagnation of the minimum wage, have contributed to income inequality. Arguably, this income inequality has been felt by minorities, especially African Americans and Latinxs, because a very high proportion of both groups is working class.
A sample of 36 Latinx households resulted in a mean household income of $47,278 with a standard deviation of $19,524. The sample mean is below the 2017 level of $50,000. In addition, eight Latinx households, or approximately 22%, make less than $30,000. Based on these results, a politician concludes that current market conditions continue to negatively impact the welfare of Latinxs. However, it is essential to provide statistically significant evidence to substantiate these claims. Toward this end, formal tests of hypotheses regarding the population mean and the population proportion are conducted. The results of the tests are summarized in Table 5.7.
TABLE 5.7 Test Statistic Values and p-Values for Hypothesis Tests
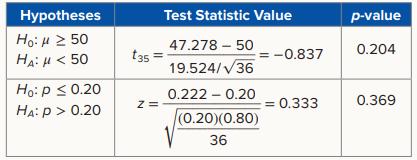
When testing whether the mean income of Latinx households has fallen below the 2017 level of $50,000, a test statistic value of −0.837 is obtained. Given a p-value of 0.204, the null hypothesis regarding the population mean, specified in Table 5.7, cannot be rejected at any reasonable level of significance. Similarly, given a p-value of 0.369, the null hypothesis regarding the population proportion cannot be rejected. Therefore, sample evidence does not support the claims that the mean income of Latinx households has fallen below $50,000 or that the proportion of Latinx households making less than $30,000 has risen above 20%. Perhaps the politician’s remarks were based on a cursory look at the sample statistics and not on a thorough statistical analysis.
Step by Step Answer:
Based on the formal tests of hypotheses conducted using the sample data provided we can analyze the ...View the full answer


Business Analytics Communicating With Numbers
ISBN: 9781260785005
1st Edition
Authors: Sanjiv Jaggia, Alison Kelly, Kevin Lertwachara, Leida Chen
