

Erin Thomas, an HR manager of an engineering firm, wants to perform an analysis on the data
Question:
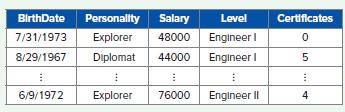
Erin Thomas, an HR manager of an engineering firm, wants to perform an analysis on the data about the company’s engineers. The variables included in the data are date of birth (BirthDate), personality type according to the Myers-Briggs Personality assessment (Personality), annual salary (Salary), level of the position (Level), and number of professional certificates achieved (Certificates). The accompanying table shows a portion of the data set.
a. Create a new variable “Age” that contains the engineers’ ages as of January 1, 2019. What is the average age of the engineers?
b. Bin the age values into three equal-size groups. Label the groups using numbers 1 (lowest age values) to 3 (highest age values). How many observations are in group 3?
c. Bin the annual salary values into four equal interval groups. Label the groups using numbers 1 (lowest salary values) to 4 (highest salary values). How many engineers are assigned to group 4?
d. Bin the number of professional certificates achieved into the following three groups: < 2, between 2 and 4, and over 4. Label the groups “Low,” “Medium,” and “High.” How many engineers are in the “High” group?
Step by Step Answer:
a Average age of the engineer 50 ...View the full answer


Business Analytics Communicating With Numbers
ISBN: 9781260785005
1st Edition
Authors: Sanjiv Jaggia, Alison Kelly, Kevin Lertwachara, Leida Chen
