

The accompanying table shows a portion of data consisting of the January, April, July, and October average
Question:
The accompanying table shows a portion of data consisting of the January, April, July, and October average temperatures of 50 selected U.S. cities.
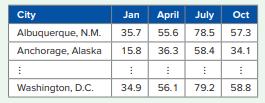
a. Perform agglomerative hierarchical clustering to group the cities based on their January, April, July, and October average temperatures. Standardize the variables and use the Euclidean distance and the Ward’s clustering method to cluster the cities into three clusters. How many cities are in the largest cluster?
b. What are the average January, April, July, and October average temperatures for the largest cluster of cities?
Fantastic news! We've Found the answer you've been seeking!
Step by Step Answer:
a Number of cities in the largest cluster Cluster 1 28 b Average Januar...View the full answer

Answered By
Utsab mitra
I have the expertise to deliver these subjects to college and higher-level students. The services would involve only solving assignments, homework help, and others.
I have experience in delivering these subjects for the last 6 years on a freelancing basis in different companies around the globe. I am CMA certified and CGMA UK. I have professional experience of 18 years in the industry involved in the manufacturing company and IT implementation experience of over 12 years.
I have delivered this help to students effortlessly, which is essential to give the students a good grade in their studies.
2+ Reviews
10+ Question Solved
Related Book For 

Business Analytics Communicating With Numbers
ISBN: 9781260785005
1st Edition
Authors: Sanjiv Jaggia, Alison Kelly, Kevin Lertwachara, Leida Chen
Question Posted:
