

The accompanying table shows a portion of quarterly data for average U.S. annual consumption (Consumption in $)
Question:
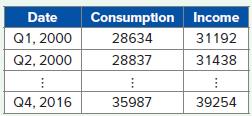
The accompanying table shows a portion of quarterly data for average U.S. annual consumption (Consumption in $) and disposable income (Income in $) for the years 2000–2016. Construct a scatterplot of Consumption against Income. Describe the relationship.
Fantastic news! We've Found the answer you've been seeking!
Step by Step Answer:
There appears to be a positive relatio...View the full answer

Answered By
JAPHETH KOGEI
Hi there. I'm here to assist you to score the highest marks on your assignments and homework. My areas of specialisation are:
Auditing, Financial Accounting, Macroeconomics, Monetary-economics, Business-administration, Advanced-accounting, Corporate Finance, Professional-accounting-ethics, Corporate governance, Financial-risk-analysis, Financial-budgeting, Corporate-social-responsibility, Statistics, Business management, logic, Critical thinking,
So, I look forward to helping you solve your academic problem.
I enjoy teaching and tutoring university and high school students. During my free time, I also read books on motivation, leadership, comedy, emotional intelligence, critical thinking, nature, human nature, innovation, persuasion, performance, negotiations, goals, power, time management, wealth, debates, sales, and finance. Additionally, I am a panellist on an FM radio program on Sunday mornings where we discuss current affairs.
I travel three times a year either to the USA, Europe and around Africa.
As a university student in the USA, I enjoyed interacting with people from different cultures and ethnic groups. Together with friends, we travelled widely in the USA and in Europe (UK, France, Denmark, Germany, Turkey, etc).
So, I look forward to tutoring you. I believe that it will be exciting to meet them.
2+ Reviews
10+ Question Solved
Related Book For 

Business Analytics Communicating With Numbers
ISBN: 9781260785005
1st Edition
Authors: Sanjiv Jaggia, Alison Kelly, Kevin Lertwachara, Leida Chen
Question Posted:
