

The accompanying table shows a portion of the average SAT math score (Math), the average SAT writing
Question:
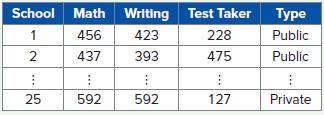
The accompanying table shows a portion of the average SAT math score (Math), the average SAT writing score (Writing), the number of test takers (Test Taker),
and whether the school is a private or public school (Type) for 25 high schools in a major metropolitan area.
a. Construct a bubble plot that shows the math score on the x-axis, the writing score on the y-axis, and the number of test takers as the size of the bubble. Do math score and writing score show a linear, nonlinear, or no relationship? If the relationship is a linear relationship, is it a positive or negative relationship? Do math score and the size of the school (using the number of test takers as a proxy) show a linear, nonlinear, or no relationship?
b. Construct a scatterplot that shows the math score on the x-axis and the writing score on the y-axis. Use different colors or symbols to show whether the high school is a private or public school. Describe the relationships between math score, writing score, and school type. Does the relationship between math score and writing score hold true for both private and public schools?
Step by Step Answer:
a The bubble plot shows a positive linear relationship be...View the full answer


Business Analytics Communicating With Numbers
ISBN: 9781260785005
1st Edition
Authors: Sanjiv Jaggia, Alison Kelly, Kevin Lertwachara, Leida Chen
