

The accompanying table shows a portion of the daily price index for the Dow Jones Industrial Average
Question:
The accompanying table shows a portion of the daily price index for the Dow Jones Industrial Average (DJIA) for the first half of 2019.
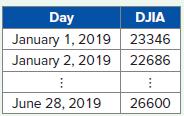
a. Construct the frequency distribution and the histogram for the DJIA. Use five intervals with widths of 22,000 < x ≤ 23,000; 23,000 < x ≤ 24,000; etc. On how many days during the first half of 2019 was the DJIA more than 26,000?
b. Is the distribution symmetric? If not, is it positively or negatively skewed?
Fantastic news! We've Found the answer you've been seeking!
Step by Step Answer:
a The DJIA was more than 26...View the full answer

Answered By
Khurram shahzad
I am an experienced tutor and have more than 7 years’ experience in the field of tutoring. My areas of expertise are Technology, statistics tasks I also tutor in Social Sciences, Humanities, Marketing, Project Management, Geology, Earth Sciences, Life Sciences, Computer Sciences, Physics, Psychology, Law Engineering, Media Studies, IR and many others.
I have been writing blogs, Tech news article, and listicles for American and UK based websites.
5+ Reviews
17+ Question Solved
Related Book For 

Business Analytics Communicating With Numbers
ISBN: 9781260785005
1st Edition
Authors: Sanjiv Jaggia, Alison Kelly, Kevin Lertwachara, Leida Chen
Question Posted:
