

The local police department is performing a crime analysis to find out which crimes are most likely
Question:
The local police department is performing a crime analysis to find out which crimes are most likely to occur at which locations. The accompanying data file contains the types of crimes (CrimeType) that occurred at various locations (Location) in the city over the past five years. A portion of the data is shown in the accompanying table.
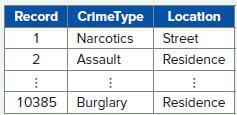
a. Construct a contingency table that shows the frequencies for CrimeType and Location combinations. How many of the crimes were for burglary and happened in a residence?
b. Construct a heat map that displays colors or color intensity based on the frequencies. Which three crime type and location combinations are the most frequent ones?
Step by Step Answer:
a There are 511 cases of a burglary in a residence b Excel Theft ...View the full answer


Business Analytics Communicating With Numbers
ISBN: 9781260785005
1st Edition
Authors: Sanjiv Jaggia, Alison Kelly, Kevin Lertwachara, Leida Chen
