

Consider the following price data from 2018 to 2020. a. Compute and interpret the simple price index
Question:
Consider the following price data from 2018 to 2020.
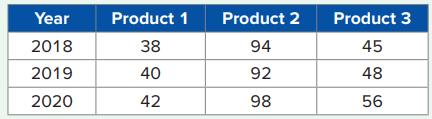
a. Compute and interpret the simple price index for each product, using 2018 as the base year.
b. Compute and interpret the unweighted aggregate price index, using 2018 as the base year.
Fantastic news! We've Found the answer you've been seeking!
Step by Step Answer:
a Relative to 2018 the price of Product 1 increased by 526 in ...View the full answer

Answered By
Cyrus Sandoval
I a web and systems developer with a vast array of knowledge in many different front end and back end languages, responsive frameworks, databases, and best code practices. My objective is simply to be the best web developer that i can be and to contribute to the technology industry all that i know and i can do. My skills include:
- Front end languages: css, HTML, Javascript, XML
- Frameworks: Angular, Jquery, Bootstrap, Jasmine, Mocha
- Back End Languages: Java, Javascript, PHP,kotlin
- Databases: MySQL, PostegreSQL, Mongo, Cassandra
- Tools: Atom, Aptana, Eclipse, Android Studio, Notepad++, Netbeans.
Having a degree in Computer Science enabled me to deeply learn most of the things regarding programming, and i believe that my understanding of problem solving and complex algorithms are also skills that have and will continue to contribute to my overall success as a developer.
I’ve worked on countless freelance projects and have been involved with a handful of notable startups. Also while freelancing I was involved in doing other IT tasks requiring the use of computers from working with data, content creation and transcription.
1+ Reviews
10+ Question Solved
Related Book For 
Business Statistics Communicating With Numbers
ISBN: 9781260716306
4th Edition
Authors: Sanjiv Jaggia, Alison Kelly
Question Posted:
