

The accompanying table shows the number of SaaS subscriptions for each type of usage for 2018, 2019,
Question:
The accompanying table shows the number of SaaS subscriptions for each type of usage for 2018, 2019, and 2020 described in the previous exercise. Use this information, along with the price data provided in the previous exercise, to solve the following problems. Assume that the base year is 2018.
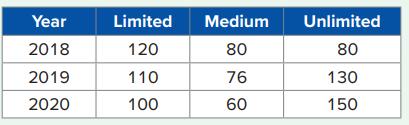
a. Compute and interpret the Laspeyres price index.
b. Compute and interpret the Paasche price index.
Fantastic news! We've Found the answer you've been seeking!
Step by Step Answer:
a Relative to 2018 the prices of the three usage type...View the full answer

Answered By
Deborah Joseph
My experience has a tutor has helped me with learning and relearning. You learn everyday actually and there are changes that are made to the curriculum every time so being a tutor has helped in keeping me updated about the present curriculum and all.
I have also been able to help over 100 students achieve better grades particularly in the categories of Math and Biology both in their internal examinations and external examinations.
2+ Reviews
10+ Question Solved
Related Book For 
Business Statistics Communicating With Numbers
ISBN: 9781260716306
4th Edition
Authors: Sanjiv Jaggia, Alison Kelly
Question Posted:
