

The following table lists a portion of the average price (in $) for a gallon of gas
Question:
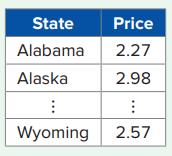
The following table lists a portion of the average price (in $) for a gallon of gas for the 50 states and the District of Columbia as reported by AAA Gas Prices on January 28, 2020.
a. Construct the frequency distribution for the average price of gas. Use six intervals with widths of 2.00 < x ≤ 2.30; 2.30 < x ≤ 2.60; etc. Which interval had the highest frequency? How many of the states had average gas prices greater than $2.90?
b. Construct the histogram. Is the distribution symmetric? If not, is it positively or negatively skewed?
| State | Price |
| Alabama | 2.27 |
| Alaska | 2.98 |
| Arkansas | 2.24 |
| Arizona | 2.82 |
| California | 3.53 |
| Colorado | 2.56 |
| Connecticut | 2.64 |
| District of Columbia | 2.67 |
| Delaware | 2.25 |
| Florida | 2.43 |
| Georgia | 2.36 |
| Hawaii | 3.67 |
| Iowa | 2.31 |
| Idaho | 2.59 |
| Illinois | 2.61 |
| Indiana | 2.38 |
| Kansas | 2.24 |
| Kentucky | 2.35 |
| Louisiana | 2.22 |
| Massachusetts | 2.56 |
| Maryland | 2.42 |
| Maine | 2.53 |
| Michigan | 2.39 |
| Minnesota | 2.40 |
| Missouri | 2.16 |
| Mississippi | 2.21 |
| Montana | 2.52 |
| North Carolina | 2.34 |
| North Dakota | 2.44 |
| Nebraska | 2.39 |
| New Hampshire | 2.46 |
| New Jersey | 2.58 |
| New Mexico | 2.38 |
| Nevada | 2.97 |
| New York | 2.69 |
| Ohio | 2.45 |
| Oklahoma | 2.22 |
| Oregon | 2.98 |
| Pennsylvania | 2.71 |
| Rhode Island | 2.55 |
| South Carolina | 2.23 |
| South Dakota | 2.42 |
| Tennessee | 2.28 |
| Texas | 2.18 |
| Utah | 2.60 |
| Virginia | 2.31 |
| Vermont | 2.64 |
| Washington | 3.10 |
| Wisconsin | 2.38 |
| West Virginia | 2.49 |
| Wyoming | 2.57 |
Fantastic news! We've Found the answer you've been seeking!
Step by Step Answer:
a The interval 230 b No the distribution is not symmetric It is ...View the full answer

Answered By
OTIENO OBADO
I have a vast experience in teaching, mentoring and tutoring. I handle student concerns diligently and my academic background is undeniably aesthetic
3+ Reviews
10+ Question Solved
Related Book For 
Business Statistics Communicating With Numbers
ISBN: 9781260716306
4th Edition
Authors: Sanjiv Jaggia, Alison Kelly
Question Posted:
