

If you have access to the data sets on the companion website, you can carry out all
Question:
If you have access to the data sets on the companion website, you can carry out all the analysis yourself; if not, look at the output shown here and interpret the findings.
First, review the income (incomeln) and well-being variables. In this chapter, we looked at a data set pertaining to countries; the countries were the units of analysis – the
“things” in which we were interested and on which the variables were defined. We looked at the relationship between the per capita income of a country (incomeln) and bad health outcomes – infant deaths and deaths of women from childbirth-related causes. We saw that higher-income countries were less likely to suffer high levels of these preventable deaths.
In this exercise, we are going to ask similar questions about inequality and bad outcomes –
maternal and infant mortality, homicide, and suicide. Might these variables be related to inequality?
a) Can you state a plausible hypothesis about inequality and preventable deaths?
b) For our inequality variable, we can choose either of two variables in the data set: the Gini coefficient or the P90/P10 income ratio, which in this data set was named richpoor.
You can see a discussion of these measures in Chapter Five, in the special boxed insert on measuring inequality.
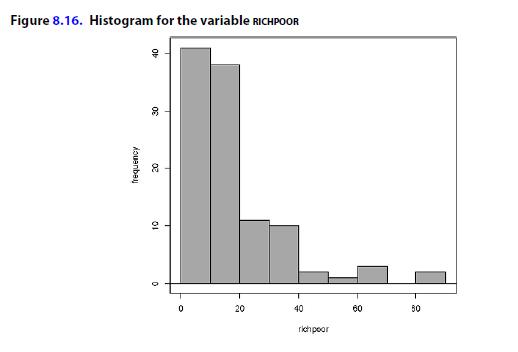
Here is what the histograms for these two variables look like.
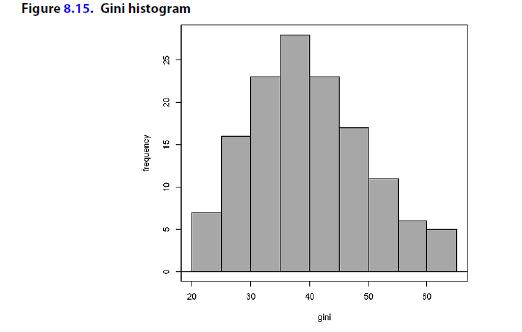
i) How would you describe the histogram for the Gini ratio?
ii) Now look at the histogram for the variable richpoor. How would you describe it?
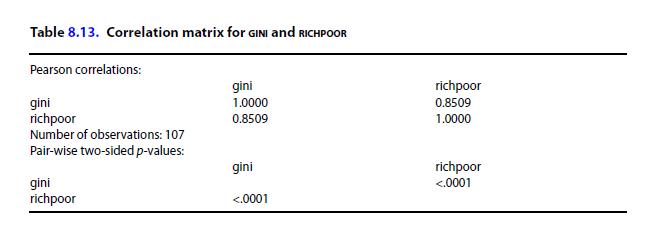
iii) You might be curious whether our two measures of inequality, the variables gini and richpoor, are related to each other – we hope they are! If these two operational variables are not related to each other, we might not have a good grasp on our more conceptual variable, inequality, and one or the other or both of the operational variables might not be valid. (Look at Chapter Two for a discussion of validity.) Look at the correlation of gini and richpoor (given in Table 8.13). What can you conclude?
iv) If we logged the variable richpoor and created a new variable, richpoorln, what might it look like? You can try this if you have access to the data set and the software, or you can draw an approximation of it, from your knowledge that we log variables to make them near normal.
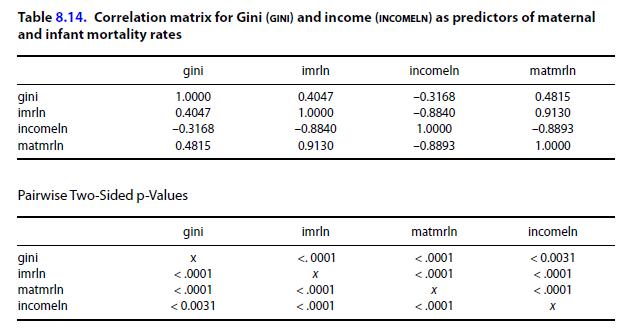
c) i) Consider some of the variables we have discussed so far that could be used to examine the relationships between inequality and health or well-being – infant mortality rate (logged), maternal mortality rate (logged), homicide rate (logged), suicide rate (logged), and income (logged). Do you think they might be related to inequality? And what do you hypothesize about their relationships with each other? Which variables are likely to have a pair-wise positive relationship? Which do you think might be pairwise negatively related? Which do you think are not related? Discuss your reasoning.
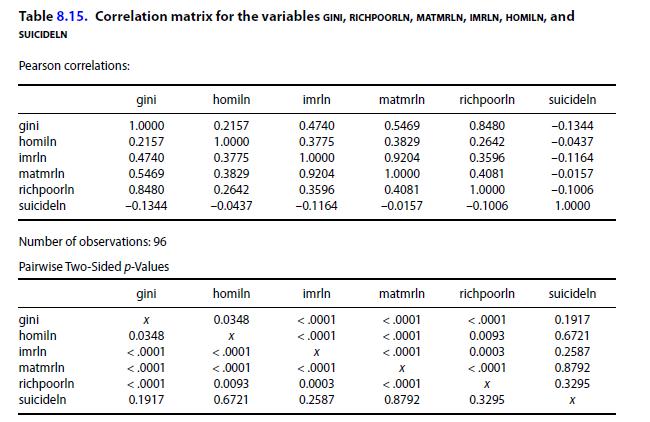
ii) Look at the two correlation matrices below and discuss what they show. One includes the homicide rate and suicide rate and the other one does not. The variables include imrln, matmrln, homiln, suicideln, and incomeln. Is richpoorln as good a predictor of these problems as incomeln? (Remember that in the chapter we found that incomeln was a good predictor.) If you have access to the website and software, you can set up the correlation matrix yourself.
iii) What have we learned about inequality from this data analysis?
Now let’s look at these correlations and also include the suicide and homicide rates.
Remember to use the logged versions of these variables if you are setting it up for yourself with website data.
Step by Step Answer:
a Plausible research hypothesis Countries with high levels of inequality have higher rates of preventable deaths and other negative health and wellbeing outcomes b Questions on different ways of measu...View the full answer


The Joy Of Stats A Short Guide To Introductory Statistics In The Social Sciences
ISBN: 9781487527297
3rd Edition
Authors: Roberta Garner, Michael Ash
