

The following table shows the percentage household savings rates in Canada and in the U.S. from 2003
Question:
The following table shows the percentage household savings rates in Canada and in the U.S. from 2003 to 2017. Use these data to develop a linear regression model to forecast the percentage change in the Canadian savings rate by the percentage change in the U.S. savings rate. Compute a Durbin-Watson statistic to determine whether significant autocorrelation is present in the model. Let α = 0.05.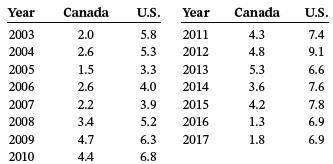
Fantastic news! We've Found the answer you've been seeking!
Step by Step Answer:
Using Table A9 for n 15 k 11 independent variable ...View the full answer

Answered By
PALASH JHANWAR
I am a Chartered Accountant with AIR 45 in CA - IPCC. I am a Merit Holder ( B.Com ). The following is my educational details.
PLEASE ACCESS MY RESUME FROM THE FOLLOWING LINK: https://drive.google.com/file/d/1hYR1uch-ff6MRC_cDB07K6VqY9kQ3SFL/view?usp=sharing
3+ Reviews
10+ Question Solved
Related Book For 
Business Statistics For Contemporary Decision Making
ISBN: 9781119577621
3rd Canadian Edition
Authors: Ken Black, Ignacio Castillo
Question Posted:
