

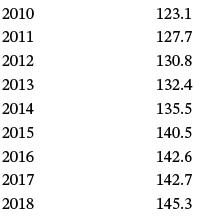
The table below shows the Consumer Price Index (CPI) for food in Canada for the years 1998
Question:
The table below shows the Consumer Price Index (CPI) for food in Canada for the years 1998 to 2018. Using regression techniques discussed in this section, analyze the data for trend. Develop a scatter plot of the data and fit the trend line through the data. Discuss the strength of the model.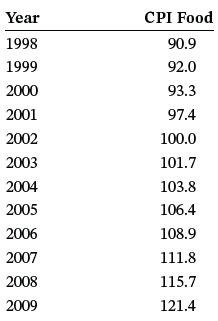
Fantastic news! We've Found the answer you've been seeking!
Step by Step Answer:
To analyze the trend in the Consumer Price Index CPI for food in Canada from 1998 to 2018 we will first create a scatter plot of the data and then fit ...View the full answer

Answered By
Diane Joyce Pastorin
Please accept my enthusiastic application to solutioninn. I would love the opportunity to be a hardworking, passionate member of your tutoring program. As soon as I read the description of the program, I knew I was a well-qualified candidate for the position.
I have extensive tutoring experience in a variety of fields. I have tutored in English as well as Calculus. I have helped students learn to analyze literature, write essays, understand historical events, and graph parabolas. Your program requires that tutors be able to assist students in multiple subjects, and my experience would allow me to do just that.
You also state in your job posting that you require tutors that can work with students of all ages. As a summer camp counselor, I have experience working with preschool and kindergarten-age students. I have also tutored middle school students in reading, as well as college and high school students. Through these tutoring and counseling positions, I have learned how to best teach each age group.
2+ Reviews
10+ Question Solved
Related Book For 
Business Statistics For Contemporary Decision Making
ISBN: 9781119577621
3rd Canadian Edition
Authors: Ken Black, Ignacio Castillo
Question Posted:
