

Coco S.A. supplies a range of computer hardware and software to 2000 schools within a large municipal
Question:
Coco S.A. supplies a range of computer hardware and software to 2000 schools within a large municipal region of Spain. When Coco S.A. won the contract the issue of customer service was considered to be central to the company being successful at the final bidding stage.
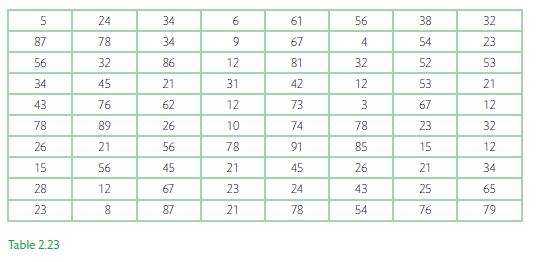
The company has now requested that its customer service director creates a series of graphical representations of the data to illustrate customer satisfaction with the service. The following data has been collected over the last six months and measures the time to respond to the received complaint (days), as presented in Table 2.23.
The customer service director has analysed this data to create a grouped frequency table and has plotted the histogram. From this he made a series of observations regarding the time to respond to customer complaints. He now wishes to extend the analysis to use numerical methods to describe this data.
(a) From the data set calculate the mean and median.
(b) Repeat the analysis to calculate the standard deviation, quartiles (Q1, Q2, and Q3), quartile range, and SIQR.
(c) Describe the shape of the distribution. Do the results suggest that there is a great deal of variation in the time taken to respond to customer complaints?
(d) Which measures would you recommend the customer service manager uses to describe the variation in time to respond to customer complaints?
(e) What conclusions can you draw from these results?
Step by Step Answer:
To analyze the data provided and answer the questions well first compute various statistical measures using the dataset Data set 5 24 34 6 61 56 38 32 87 78 34 9 67 4 54 23 56 32 86 12 81 32 52 53 34 ...View the full answer


