

Consider the set of data that represents the number of insurance claims processed each day by an
Question:
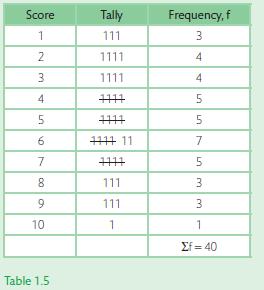
Consider the set of data that represents the number of insurance claims processed each day by an insurance fi rm over a period of 40 days: 3, 5, 9, 6, 4, 7, 8, 6, 2, 5, 10, 1, 6, 3, 6, 5, 4, 7, 8, 4, 5, 9, 4, 2, 7, 6, 1, 3, 5, 6, 2, 6, 4, 8, 3, 1, 7, 9, 7 and 2.
The frequency distribution can be used to show how many days it took for one claim to be processed, how many days it took to process two claims, and so on. The simplest way of doing this is by creating a tally chart.
Write down the range of values from the lowest (1) to the highest (10) then go through the data set recording each score in the table with a tally mark. It’s a good idea to cross out figures in the data set as you go through it to prevent double counting. Table 1.5 illustrates the frequency distribution for the data set given.
Step by Step Answer:
It seems like the table you provided is a tally chart representing the frequency distribution of the ...View the full answer


