

Construct a scatter plot for the data in Table 8.4 and calculate Pearsons correlation coefficient, r. Comment
Question:
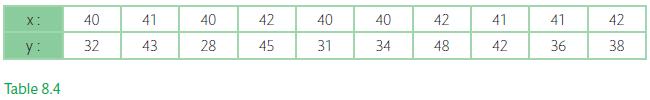
Construct a scatter plot for the data in Table 8.4 and calculate Pearson’s correlation coefficient, r. Comment on the strength of the correlation between x and y.
Fantastic news! We've Found the answer you've been seeking!
Step by Step Answer:
The scatter plo...View the full answer

Answered By
Irfan Ali
I have a first class Accounting and Finance degree from a top university in the World. With 5+ years experience which spans mainly from the not for profit sector, I also have vast experience in preparing a full set of accounts for start-ups and small and medium-sized businesses. My name is Irfan Ali and I am seeking a wide range of opportunities ranging from bookkeeping, tax planning, business analysis, Content Writing, Statistic, Research Writing, financial accounting, and reporting.
249+ Reviews
530+ Question Solved
Related Book For 

Question Posted:
