

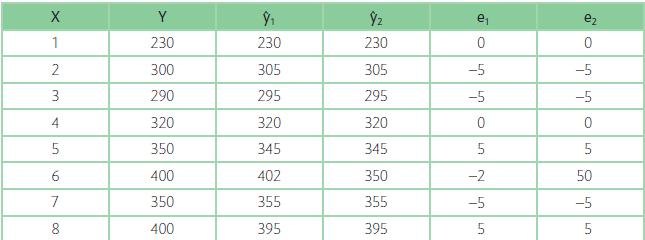
Two forecasts were produced, as shown in Table 9.11. The ME for the second forecast is some
Question:
Two forecasts were produced, as shown in Table 9.11. The ME for the second forecast is some seven times larger than the ME for the first forecast. However, the MSE is some 20 times larger. Can you explain?

Fantastic news! We've Found the answer you've been seeking!
Step by Step Answer:

Answered By
Utsab mitra
I have the expertise to deliver these subjects to college and higher-level students. The services would involve only solving assignments, homework help, and others.
I have experience in delivering these subjects for the last 6 years on a freelancing basis in different companies around the globe. I am CMA certified and CGMA UK. I have professional experience of 18 years in the industry involved in the manufacturing company and IT implementation experience of over 12 years.
I have delivered this help to students effortlessly, which is essential to give the students a good grade in their studies.
2+ Reviews
10+ Question Solved
Related Book For 

Question Posted:
