

Use the Excel TREND() function to fit a trend line to the Example 8.1 data set, as
Question:
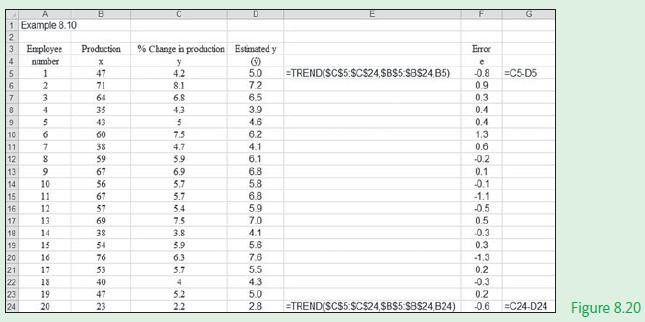
Use the Excel TREND() function to fit a trend line to the Example 8.1 data set, as illustrated in Figure 8.20.
Data from Example 8.1
A large manufacturing firm with some 8000 employees has designed a training programme that is supposed to increase the production of employees. The personnel manager decides to examine this claim by analysing the data results from the first group of 20 employees that attended the course.
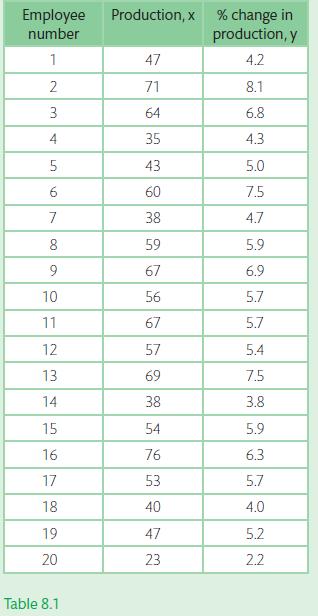
Table 8.1 provides the data set for the % change in production (y) measured against a range of production values (x).
Fantastic news! We've Found the answer you've been seeking!
Step by Step Answer:
Excel solution x Cells B5B24 y Cell...View the full answer

Answered By
Allan Olal
I have vast tutoring experience of more than 8 years and my primary objective as a tutor is to ensure that a student achieves their academic goals.
78+ Reviews
409+ Question Solved
Related Book For 

Question Posted:
