

1. Indicate whether a table or a graph is the preferred method of presentation in the following...
Question:
1. Indicate whether a table or a graph is the preferred method of presentation in the following situations:
a. Distribution by site, sex, race, and time period of all cancers in your healthcare facility
b. Survival trends over time by sex for lung cancer
c. Display of prostate cancer stage of disease for a presentation at a professional conference
d. Detailed treatment distribution of breast cancer for a physician on the staff of your hospital
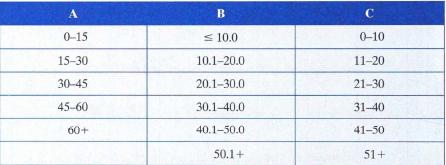
2. Indicate which of the following categories (A, B, and C) are mutually exclusive and clearly defined.
3. In September 20XX, Community Hospital discharged 150 patients.
• 105 patients were discharged home • 6 patients were discharged home with follow-up home health • 5 patients died • 15 patients were transferred to a skilled nursing facility • 7 patients were transferred to another acute care facility • 12 patients were transferred to a rehabilitation hospital Complete a pie chart of this information.
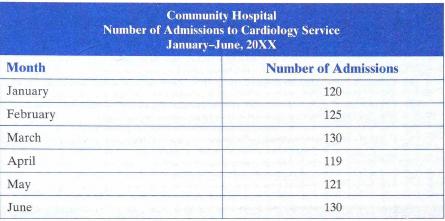
4. Using the information in the table below, create a line graph of the data
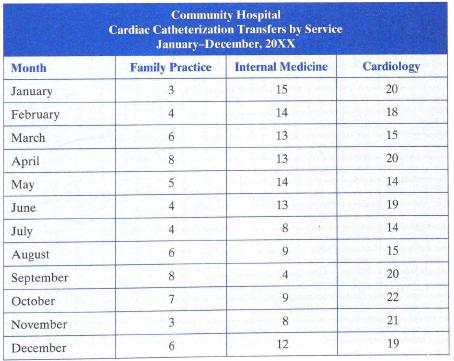
5. The cardiology team at Community Hospital would like to convince the hospital administration that a cardiac catheterization lab is needed because they are transferring patients from Community Hospital to University Hospital for their needed catheterizations. One of the cardiologists asks you to prepare a graph for a presentation to the admissions department of the number of transfers they have had over the past year. The data are listed below.
Step by Step Answer:

This question has not been answered yet.
You can Ask your question!

Calculating And Reporting Healthcare Statistics
ISBN: 9781584265955
5th Revised Edition
Authors: Loretta A. Horton
