

A sales manager for a major pharmaceutical company analyzes last years sales data for 96 sales representatives,
Question:
A sales manager for a major pharmaceutical company analyzes last year’s sales data for 96 sales representatives, grouping them by region (1 = East Coast U.S.; 2 = Midwest U.S.; 3 = West U.S.; 4 = South U.S.; 5 = Canada; 6 = Rest of World). She plots Sales (in $1000) against Region (1–6) and sees a strong negative correlation:
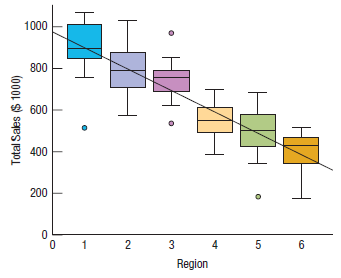
She fits a regression to the data and finds
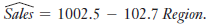
The R2 is 70.5%.
Write a few sentences interpreting this model and describing what she can conclude from this analysis.
Fantastic news! We've Found the answer you've been seeking!
Step by Step Answer:
The model is meaningless because the variable Region is c...View the full answer

Answered By
PALASH JHANWAR
I am a Chartered Accountant with AIR 45 in CA - IPCC. I am a Merit Holder ( B.Com ). The following is my educational details.
PLEASE ACCESS MY RESUME FROM THE FOLLOWING LINK: https://drive.google.com/file/d/1hYR1uch-ff6MRC_cDB07K6VqY9kQ3SFL/view?usp=sharing
3+ Reviews
10+ Question Solved
Related Book For 

Business Statistics
ISBN: 9780133899122
3rd Canadian Edition
Authors: Norean D. Sharpe, Richard D. De Veaux, Paul F. Velleman, David Wright
Question Posted:
