

A survey conducted at a state university that asked students what brand of digital music device they
Question:
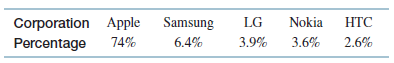
a. Generate a bar chart to display these data.
b. Generate a pie chart to display these data.
c. Which of the two displays more effectively presents the data? Explain your answer.
Fantastic news! We've Found the answer you've been seeking!
Step by Step Answer:
a b c A case can be made for either a bar chart or a pie chart Pie charts are espec...View the full answer

Answered By
Rishabh Ojha
During my undergraduate i used to participate as TA (Teaching Assistant) in several electronics and computers subject. I'm passionate about learning Computer Science as my bachelors are in Electronics but i learnt most of the Computer Science subjects on my own which Machine Learning also. At Present, i'm a working professional pursuing my career as a Machine Learning Engineer and i want to help others learn during my free hours, that's all the motivation behind giving tuition. To be frank i have no prior experience of tutoring but i have solved problems on opensource platforms like StackOverflow and github. ~Thanks
3+ Reviews
10+ Question Solved
Related Book For 
Business Statistics A Decision Making Approach
ISBN: 9780134496498
10th Edition
Authors: David F. Groebner, Patrick W. Shannon, Phillip C. Fry
Question Posted:
