

Consider Exercise 3.20. a. Compute and interpret the zscore for each total spending figure. b. Compute and
Question:
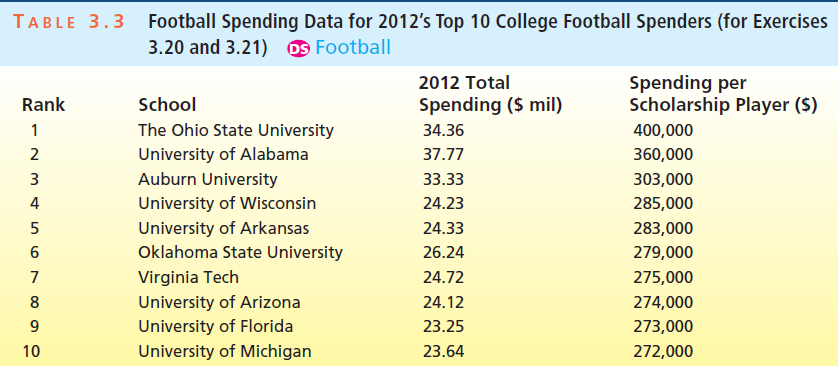
a. Compute and interpret the z€“score for each total spending figure.
b. Compute and interpret the z€“score for each spending per scholarship player figure.
Fantastic news! We've Found the answer you've been seeking!
Step by Step Answer:
a Total spending 27599 51075 round this to 5108 x x z x Interpretation 3436 6761 1324 x is 1324 stan...View the full answer

Answered By
Anurag Agrawal
I am a highly enthusiastic person who likes to explain concepts in simplified language. Be it in my job role as a manager of 4 people or when I used to take classes for specially able kids at our university. I did this continuously for 3 years and my god, that was so fulfilling. Sometimes I've skipped my own classes just to teach these kids and help them get their fair share of opportunities, which they would have missed out on. This was the key driver for me during that time. But since I've joined my job I wasn't able to make time for my passion of teaching due to hectic schedules. But now I've made a commitment to teach for at least an hour a day.
I am highly proficient in school level math and science and reasonably good for college level. In addition to this I am especially interested in courses related to finance and economics. In quest to learn I recently gave the CFA level 1 in Dec 19, hopefully I'll clear it. Finger's crossed :)
2+ Reviews
10+ Question Solved
Related Book For 
Business Statistics In Practice Using Data Modeling And Analytics
ISBN: 9781259549465
8th Edition
Authors: Bruce L Bowerman, Richard T O'Connell, Emilly S. Murphree
Question Posted:
