

Data 2.7 on page 95 introduces the dataset HollywoodMovies, which contains information on more than 900 movies
Question:
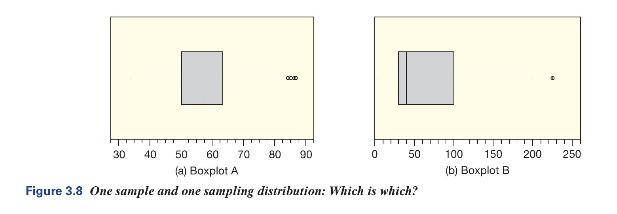
Data 2.7 on page 95 introduces the dataset HollywoodMovies, which contains information on more than 900 movies that came out of Hollywood between 2007 and 2013. One of the variables is the budget (in millions of dollars) to make the movie. Figure 3.8 shows two boxplots. One represents the budget data for one random sample of size n = 30. The other represents the values in a sampling distribution of 1000 means of budget data from samples of size 30.
(a) Which is which? Explain.
(b) From the boxplot showing the data from one random sample, what does one value in the sample represent? How many values are included in the data to make the boxplot? Estimate the minimum and maximum values. Give a rough estimate of the mean of the values and use appropriate notation for your answer.
(c) From the boxplot showing the data from a sampling distribution, what does one value in the sampling distribution represent? How many values are included in the data to make the boxplot? Estimate the minimum and maximum values. Give a rough estimate of the value of the population parameter and use appropriate notation for your answer.
Data 2.7:
Over 900 movies came out of Hollywood between 2007 and 2013 and the dataset HollywoodMovies contains lots of information on these movies, such as studio, genre, budget, audience ratings, box office average opening weekend, world gross, and others.
Step by Step Answer:


Statistics, Enhanced Unlocking The Power Of Data
ISBN: 9781119308843
2nd Edition
Authors: Robin H Lock, Patti Frazer Lock, Kari Lock Morgan, Eric F Lock, Dennis F Lock
