

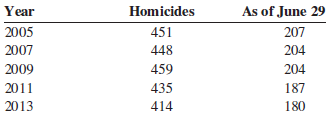
Draw and compare two time series graphs for the number of homicides in the Chicago area. As
Question:
Fantastic news! We've Found the answer you've been seeking!
Step by Step Answer:
Theres no way to tell if the crime ...View the full answer

Answered By
Mario Alvarez
I teach Statistics and Probability for students of my university ( Univerisity Centroamerican Jose Simeon Canas) in my free time and when students ask for me, I prepare and teach students that are in courses of Statistics and Probability. Also I teach students of the University Francisco Gavidia and Universidad of El Salvador that need help in some topics about Statistics, Probability, Math, Calculus. I love teaching Statistics and Probability! Why me?
** I have experience in Statistics and Probability topics for middle school, high school and university.
** I always want to share my knowledge with my students and have a great relationship with them.
** I have experience working with students online.
** I am very patient with my students and highly committed with them
1+ Reviews
10+ Question Solved
Related Book For 
Elementary Statistics A Step By Step Approach
ISBN: 9781259755330
10th Edition
Authors: Allan G. Bluman
Question Posted:
