

Figure 2.86 shows a scatterplot illustrating three different variables from the dataset HappyPlanetIndex. The variable Happiness is
Question:
Figure 2.86 shows a scatterplot illustrating three different variables from the dataset HappyPlanetIndex. The variable Happiness is a measure of the well-being of a country, with larger numbers indicating greater happiness, health, and well-being. The variable Footprint is a per capita measure of the ecological impact of a country on the environment, with larger numbers indicating greater use of resources (such as gas and electricity) and more damage to the planet. A third variable, Region, is given by the code shown in the top right, and is categorized as follows: $1=$ Latin America, $2=$ Western nations, $3=$ Middle East, $4=$ Sub-Saharan Africa, $5=$ South Asia, $6=$ East Asia, 7 = former Communist countries.
(a) Classify each of the three variables as categorical or quantitative.
(a)
(b)
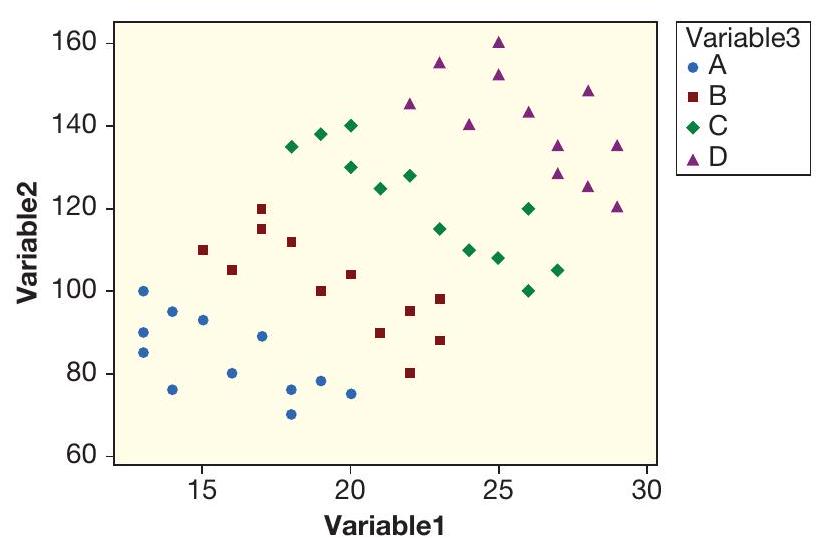
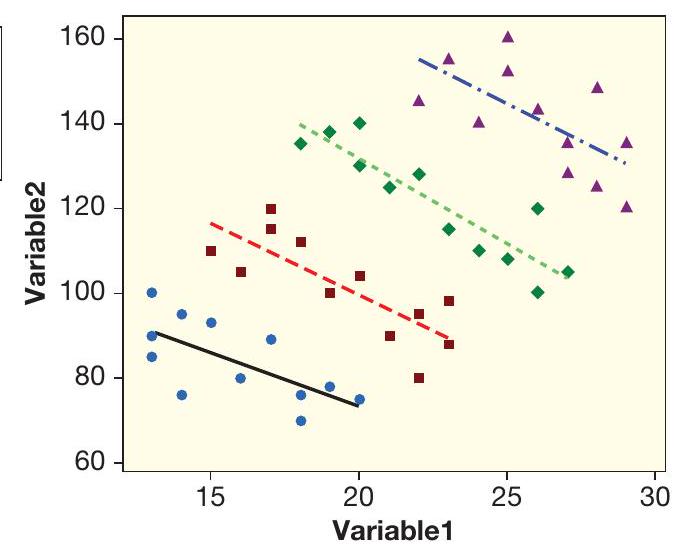
Figure 2.85 Describe the association in each group
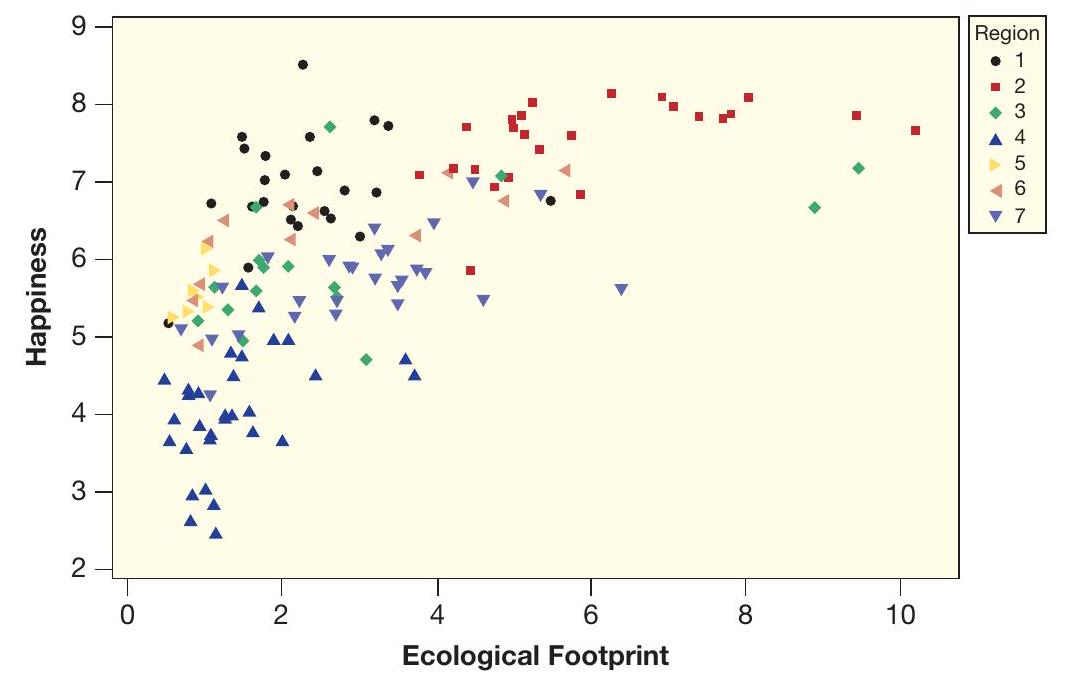
Figure 2.86 Happiness, ecological footprint, and region
(b) Which two regions seem to have the greatest happiness score? Which region seems to have the greatest ecological footprint?
(c) Which region seems to have the lowest happiness score? Does the ecological footprint tend to be high or low in that area?
(d) Looking at the scatterplot overall and ignoring region, does there appear to be a positive relationship between happiness score and ecological footprint?
(e) Considering only region 2 (Western nations), does there appear to be a positive relationship between happiness score and ecological footprint?
(f) The country with the highest happiness score is Costa Rica. Is it in the top left, top right, bottom left, or bottom right of the scatterplot?
(g) According to Nic Marks, the developer of the Happy Planet Index, we should be trying to move more countries to the top left of the scatterplot. To do this for countries in region 4 (Sub-Saharan Africa), which variable should we focus on and should we be trying to increase or decrease this variable for these countries? For countries in region 2 (Western nations), which variable should we focus on and should we be trying to increase or decrease this variable for these countries?
Step by Step Answer:


Statistics, Enhanced Unlocking The Power Of Data
ISBN: 9781119308843
2nd Edition
Authors: Robin H Lock, Patti Frazer Lock, Kari Lock Morgan, Eric F Lock, Dennis F Lock
