

In the book Tools and Methods for the Improvement of Quality, Gitlow, Gitlow, Oppenheim, and Oppenheim present
Question:
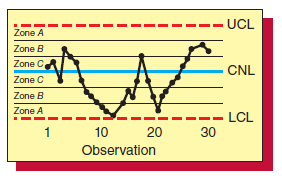
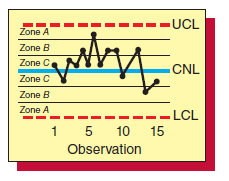
Figure 16.18
a.
b.
Fantastic news! We've Found the answer you've been seeking!
Step by Step Answer:
a There is a run down of 10 points subgroups 4 through 13 a run of 11 po...View the full answer

Answered By
Mugdha Sisodiya
My self Mugdha Sisodiya from Chhattisgarh India. I have completed my Bachelors degree in 2015 and My Master in Commerce degree in 2016. I am having expertise in Management, Cost and Finance Accounts. Further I have completed my Chartered Accountant and working as a Professional.
Since 2012 I am providing home tutions.
2+ Reviews
10+ Question Solved
Related Book For 
Business Statistics In Practice Using Data Modeling And Analytics
ISBN: 9781259549465
8th Edition
Authors: Bruce L Bowerman, Richard T O'Connell, Emilly S. Murphree
Question Posted:
