

The following display is a graph similar to one that appeared in USA TODAY (June 29, 2009).
Question:
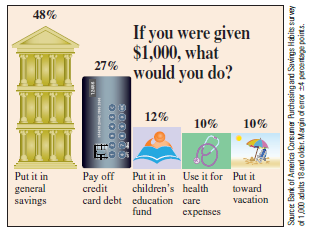
The following display is a graph similar to one that appeared in USA TODAY (June 29, 2009). This graph is meant to be a bar graph of responses to the question shown in the graph.
a. Is response to the question a categorical or numerical variable?
b. Explain why a bar chart rather than a dotplot was used to display the response data.
c. There must have been an error made in constructing this graph. How can you tell that the graph is not a correct representation of the response data?
Fantastic news! We've Found the answer you've been seeking!
Step by Step Answer:
a Categorical b Since the variable being ...View the full answer

Answered By
Joseph Mwaura
I have been teaching college students in various subjects for 9 years now. Besides, I have been tutoring online with several tutoring companies from 2010 to date. The 9 years of experience as a tutor has enabled me to develop multiple tutoring skills and see thousands of students excel in their education and in life after school which gives me much pleasure. I have assisted students in essay writing and in doing academic research and this has helped me be well versed with the various writing styles such as APA, MLA, Chicago/ Turabian, Harvard. I am always ready to handle work at any hour and in any way as students specify. In my tutoring journey, excellence has always been my guiding standard.
1+ Reviews
10+ Question Solved
Related Book For 

Introduction To Statistics And Data Analysis
ISBN: 9781337793612
6th Edition
Authors: Roxy Peck, Chris Olsen, Tom Short
Question Posted:
