

The following graph shows: a. Strong positive correlation b. Strong negative correlation c. Moderately positive correlation d.
Question:
The following graph shows:
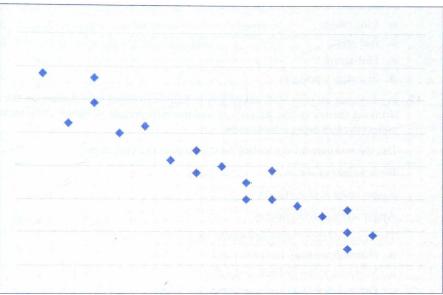
a. Strong positive correlation
b. Strong negative correlation
c. Moderately positive correlation
d. Moderately negative correlation
Step by Step Answer:

This question has not been answered yet.
You can Ask your question!
Related Book For 
Calculating And Reporting Healthcare Statistics
ISBN: 9781584265955
5th Revised Edition
Authors: Loretta A. Horton
Question Posted:
