

The following table shows the U.S. market share for smartphone manufacturers in 2017 according to the research
Question:
The following table shows the U.S. market share for smartphone manufacturers in 2017 according to the research firm comScore. The table also shows the frequency of purchases of smartphones by brand for a random sample of customers during 2018.
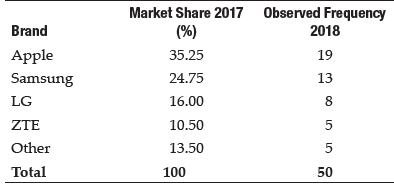
a. Using ? = 0.05, perform a chi-square test to determine if the observed frequencies in the table are consistent with the report.
b. Determine the p-value for the chi-square test statistic using Excel and interpret its meaning.
Fantastic news! We've Found the answer you've been seeking!
Step by Step Answer:
a H 0 The market share for US smartphone manufacturers in 2014 is consistent with t...View the full answer

Answered By
Nazrin Ziad
I am a post graduate in Zoology with specialization in Entomology.I also have a Bachelor degree in Education.I posess more than 10 years of teaching as well as tutoring experience.I have done a project on histopathological analysis on alcohol treated liver of Albino Mice.
I can deal with every field under Biology from basic to advanced level.I can also guide you for your project works related to biological subjects other than tutoring.You can also seek my help for cracking competitive exams with biology as one of the subjects.
2+ Reviews
10+ Question Solved
Related Book For 

Question Posted:
