

The scatterplot shown below displays the 2013 Minnesota State Fair daily attendance (Y) and the daily high
Question:
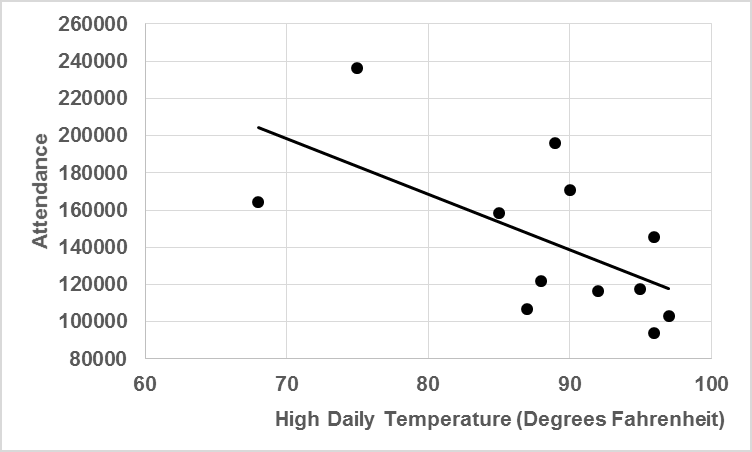
a. For these data, r2 equals .38. Calculate r. (Pay careful attention to the nature of the relationship between temperature and attendance.)
b. According to Cohen€™s guidelines, is the relationship between the high daily temperature weak, moderate, or strong?
c. Two data points in the scatterplot that are associated with the two lowest temperatures appear to be associated with fairly large prediction error. The coordinates of the two data points are (75, 236197) and (68, 164277). What might be a possible explanation for the relatively large prediction errors?
Fantastic news! We've Found the answer you've been seeking!
Step by Step Answer:
a The square root of 38 is either 62 or 62 In this case r equal...View the full answer

Answered By
Rohail Amjad
Experienced Finance Guru have a full grip on various sectors, i.e Media, Insurance, Automobile, Rice and other Financial Services.
Have also served in Business Development Department as a Data Anlayst
32+ Reviews
83+ Question Solved
Related Book For 

Question Posted:
