

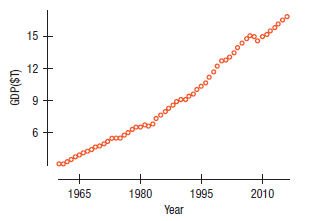
The scatterplot shows the gross domestic product (GDP) of the United States in trillions of (2010) dollars
Question:
The scatterplot shows the gross domestic product (GDP) of the United States in trillions of (2010) dollars plotted against years since 1960. (Data in GDP and DJIA 2017)
A linear model fit to the relationship looks like this: (We?ve included much of the regression table as you?d see it from a statistics program.)
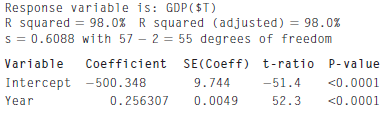
a) Does the value 98.0% suggest that this is a good model? Explain.
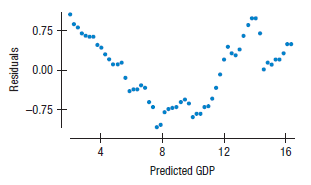
b) Here?s a scatterplot of the residuals. Now do you think this is a good model for these data? Explain?
Fantastic news! We've Found the answer you've been seeking!
Step by Step Answer:
a Although nearly 98 of the variation ...View the full answer

Answered By
GERALD KAMAU
non-plagiarism work, timely work and A++ work
6+ Reviews
11+ Question Solved
Related Book For 

Business Statistics
ISBN: 9780134705217
4th Edition
Authors: Norean Sharpe, Richard Veaux, Paul Velleman
Question Posted:
