

Use the data from the David County science competition supplied in Exercise 2.6. Construct a bar graph
Question:
Use the data from the David County science competition supplied in Exercise 2.6. Construct a bar graph that shows the county-wide population percentage of students at each school.
Exercise 2.6.
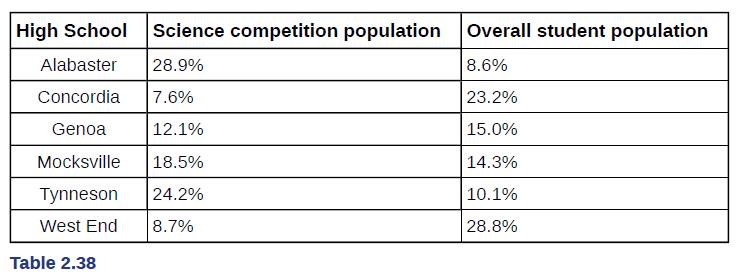
David County has six high schools. Each school sent students to participate in a county-wide science competition. Table 2.38 shows the percentage breakdown of competitors from each school, and the percentage of the entire student population of the county that goes to each school. Construct a bar graph that shows the population percentage of competitors from each school.
Step by Step Answer:

This question has not been answered yet.
You can Ask your question!
Related Book For 
Introductory Business Statistics
ISBN: 202318
1st Edition
Authors: Alexander Holmes , Barbara Illowsky , Susan Dean
Question Posted:
