

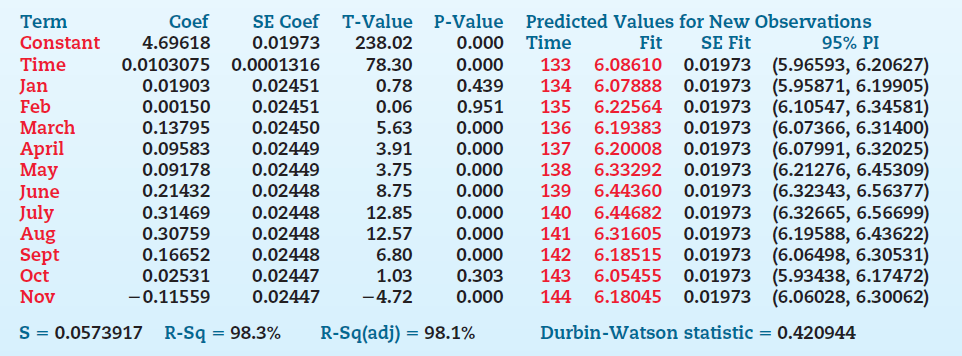
Use the DurbinWatson statistic given at the bottom of the Minitab output in Figure 15.9(c) to assess
Question:
Figure 15.9(c)
Fantastic news! We've Found the answer you've been seeking!
Step by Step Answer:
DurbinWatson d 042 Table A10 onl...View the full answer

Answered By
Madhur Jain
I have 6 years of rich teaching experience in subjects like Mathematics, Accounting, and Entrance Exams preparation. With my experience, I am able to quickly adapt to the student's level of understanding and make the best use of his time.
I focus on teaching concepts along with the applications and what separates me is the connection I create with my students. I am well qualified for working on complex problems and reaching out to the solutions in minimal time. I was also awarded 'The Best Tutor Award' for 2 consecutive years in my previous job.
Hoping to get to work on some really interesting problems here.
1+ Reviews
10+ Question Solved
Related Book For 
Business Statistics In Practice Using Data Modeling And Analytics
ISBN: 9781259549465
8th Edition
Authors: Bruce L Bowerman, Richard T O'Connell, Emilly S. Murphree
Question Posted:
