

Use the KruskalWallis H test and the Minitab output in Figure 17.5 to compare the bottom (B),
Question:
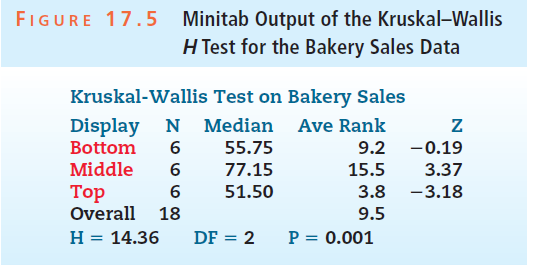
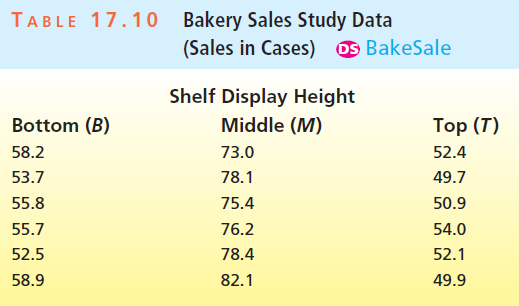
Use the given independent samples to perform the Kruskal€“Wallis H test of the null hypothesis H0 that the corresponding populations are identical versus the alternative hypothesis Ha that at least two populations differ in location.
Fantastic news! We've Found the answer you've been seeking!
Step by Step Answer:
For the original data with n 1 n 2 n 3 6 H 1436 2 052 599...View the full answer

Answered By
OTIENO OBADO
I have a vast experience in teaching, mentoring and tutoring. I handle student concerns diligently and my academic background is undeniably aesthetic
3+ Reviews
10+ Question Solved
Related Book For 

Business Statistics In Practice Using Data Modeling And Analytics
ISBN: 9781259549465
8th Edition
Authors: Bruce L Bowerman, Richard T O'Connell, Emilly S. Murphree
Question Posted:
