

In Exercises use the graph to find the limit (if it exists). If the limit does not
Question:
In Exercises use the graph to find the limit (if it exists). If the limit does not exist, explain why.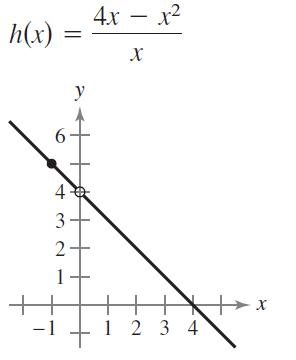
a.
b.
Fantastic news! We've Found the answer you've been seeking!
Step by Step Answer:
a To find lim x0 hx we can simply look at the graph of hx near x0 We see that as x approaches 0 from ...View the full answer

Answered By
Mary Boke
I have teached the student upto class 12th as well as my fellow mates.I have a good command in engineering,maths and science.I scored 90+ marks in 10th and 12th in maths.
0 Reviews
10+ Question Solved
Related Book For 

Question Posted:
