

The ages x (in years) and systolic blood pressures y of seven men are shown in the
Question:
The ages x (in years) and systolic blood pressures y of seven men are shown in the table.
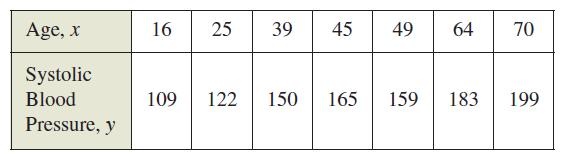
(a) Use the regression capabilities of a graphing utility to find the least squares regression line for the data.
(b) Use the model to approximate the change in systolic blood pressure for each one-year increase in age.
Fantastic news! We've Found the answer you've been seeking!
Step by Step Answer:
a Using a graphing utility ...View the full answer

Answered By
Muhammad Haroon
More than 3 years experience in teaching undergraduate and graduate level courses which includes Object Oriented Programming, Data Structures, Algorithms, Database Systems, Theory of Automata, Theory of Computation, Database Administration, Web Technologies etc.
3+ Reviews
10+ Question Solved
Related Book For 

Question Posted:
