

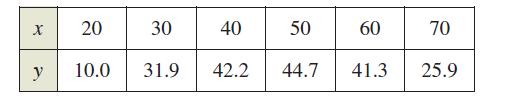
The data in the table show the median income y(in thousands of dollars) for males of various
Question:
The data in the table show the median income y(in thousands of dollars) for males of various ages x in the United States in 2009.
(a) Use the regression capabilities of a graphing utility to find a quadratic model for the data.
(b) Use a graphing utility to plot the data and graph the model.
(c) Use the model to approximate the median income for a male who is 26 years old.
(d) Use the model to approximate the median income for a male who is 34 years old.
Fantastic news! We've Found the answer you've been seeking!
Step by Step Answer:
a b c d Usin...View the full answer

Answered By
S Mwaura
A quality-driven writer with special technical skills and vast experience in various disciplines. A plagiarism-free paper and impeccable quality content are what I deliver. Timely delivery and originality are guaranteed. Kindly allow me to do any work for you and I guarantee you an A-worthy paper.
27+ Reviews
73+ Question Solved
Related Book For 

Question Posted:
