

Figure 13 displays the voltage V across a capacitor as a function of time while the capacitor
Question:
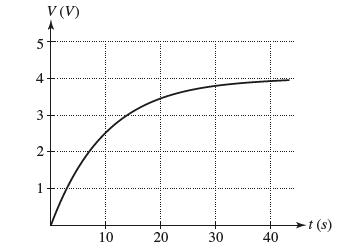
Figure 13 displays the voltage V across a capacitor as a function of time while the capacitor is being charged. Estimate the rate of change of voltage at t = 20 s. Indicate the values in your calculation and include proper units. Does voltage change more quickly or more slowly as time goes on? Explain in terms of tangent lines.
Fantastic news! We've Found the answer you've been seeking!
Step by Step Answer:
The tangent line sketched in the figure below appears to pass t...View the full answer

Answered By
Khurram shahzad
I am an experienced tutor and have more than 7 years’ experience in the field of tutoring. My areas of expertise are Technology, statistics tasks I also tutor in Social Sciences, Humanities, Marketing, Project Management, Geology, Earth Sciences, Life Sciences, Computer Sciences, Physics, Psychology, Law Engineering, Media Studies, IR and many others.
I have been writing blogs, Tech news article, and listicles for American and UK based websites.
5+ Reviews
17+ Question Solved
Related Book For 

Question Posted:
