

Figure 14 shows the graph of (x) = x sin x. Let (a) Locate the local max
Question:
Figure 14 shows the graph of ƒ(x) = x sin x. Let 
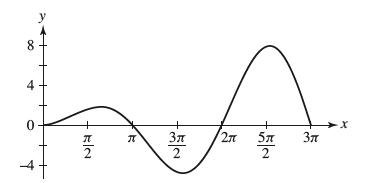
(a) Locate the local max and absolute max of F on [0, 3π].
(b) Justify graphically: F has precisely one zero in [π, 2π].
(c) How many zeros does F have in [0, 3π]?
(d) Find the inflection points of F on [0, 3π]. For each one, state whether the concavity changes from up to down or from down to up.
Fantastic news! We've Found the answer you've been seeking!
Step by Step Answer:
Let Fx ft sint dt A graph of fx x sinx is depicted in Figure 14 Note that Fx fx and Fx fx a For F to ...View the full answer

Answered By
Utsab mitra
I have the expertise to deliver these subjects to college and higher-level students. The services would involve only solving assignments, homework help, and others.
I have experience in delivering these subjects for the last 6 years on a freelancing basis in different companies around the globe. I am CMA certified and CGMA UK. I have professional experience of 18 years in the industry involved in the manufacturing company and IT implementation experience of over 12 years.
I have delivered this help to students effortlessly, which is essential to give the students a good grade in their studies.
2+ Reviews
10+ Question Solved
Related Book For 

Question Posted:
