

Figure 5 shows the graph of r = e 0.5 sin for 0
Question:
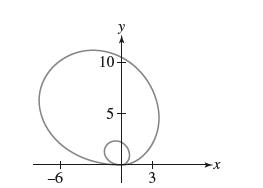
Figure 5 shows the graph of r = e0.5θ sin θ for 0 ≤ θ ≤ 2π. Use a computer algebra system to approximate the difference in length between the outer and inner loops.
Fantastic news! We've Found the answer you've been seeking!
Step by Step Answer:
We note that the inner loop is the curve for 0 7 and the o...View the full answer

Answered By
PALASH JHANWAR
I am a Chartered Accountant with AIR 45 in CA - IPCC. I am a Merit Holder ( B.Com ). The following is my educational details.
PLEASE ACCESS MY RESUME FROM THE FOLLOWING LINK: https://drive.google.com/file/d/1hYR1uch-ff6MRC_cDB07K6VqY9kQ3SFL/view?usp=sharing
3+ Reviews
10+ Question Solved
Related Book For 

Question Posted:
