

Figure 8 shows the graph of the position s of an object as a function of time
Question:
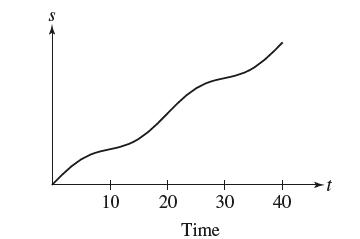
Figure 8 shows the graph of the position s of an object as a function of time t. Determine the intervals on which the acceleration is positive.
Fantastic news! We've Found the answer you've been seeking!
Step by Step Answer:
Roughly from time 10 to time 2...View the full answer

Answered By
Mary Boke
As an online tutor with over seven years of experience and a PhD in Education, I have had the opportunity to work with a wide range of students from diverse backgrounds. My experience in education has allowed me to develop a deep understanding of how students learn and the various approaches that can be used to facilitate their learning. I believe in creating a positive and inclusive learning environment that encourages students to ask questions and engage with the material. I work closely with my students to understand their individual learning styles, strengths, and challenges to tailor my approach accordingly. I also place a strong emphasis on building strong relationships with my students, which fosters trust and creates a supportive learning environment. Overall, my goal as an online tutor is to help students achieve their academic goals and develop a lifelong love of learning. I believe that education is a transformative experience that has the power to change lives, and I am committed to helping my students realize their full potential.
4+ Reviews
21+ Question Solved
Related Book For 

Question Posted:
