

Figure 2 shows the graph of a function f. At which numbers is f discontinuous? Why? Figure
Question:
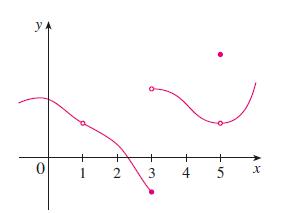
Figure 2 shows the graph of a function f. At which numbers is f discontinuous? Why?
Figure 2
Fantastic news! We've Found the answer you've been seeking!
Step by Step Answer:
It looks as if there is a discontinuity when a 1 be...View the full answer

Answered By
Ayush Jain
Subjects in which i am expert:
Computer Science :All subjects (Eg. Networking,Database ,Operating System,Information Security,)
Programming : C. C++, Python, Java, Machine Learning,Php
Android App Development, Xamarin, VS app development
Essay Writing
Research Paper
History, Management Subjects
Mathematics :Till Graduate Level
1+ Reviews
10+ Question Solved
Related Book For 
Question Posted:
