

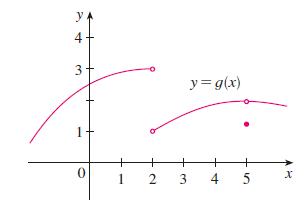
The graph of a function g is shown in Figure 10. Use it to state the values
Question:
The graph of a function g is shown in Figure 10. Use it to state the values (if they exist) of the following:
Figure 10
Fantastic news! We've Found the answer you've been seeking!
Step by Step Answer:
From the graph we see that the values of gx approach 3 as x approaches 2 from the ...View the full answer

Answered By
Deborah Joseph
My experience has a tutor has helped me with learning and relearning. You learn everyday actually and there are changes that are made to the curriculum every time so being a tutor has helped in keeping me updated about the present curriculum and all.
I have also been able to help over 100 students achieve better grades particularly in the categories of Math and Biology both in their internal examinations and external examinations.
2+ Reviews
10+ Question Solved
Related Book For 
Question Posted:
