

Graphs of the position functions of two particles are shown, where t is measured in seconds. When
Question:
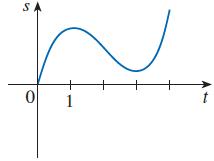
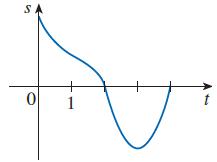
Graphs of the position functions of two particles are shown, where t is measured in seconds. When is the velocity of each particle positive? When is it negative? When is each particle speeding up? When is it slowing down? Explain.
(a)
(b)
Fantastic news! We've Found the answer you've been seeking!
Step by Step Answer:
a The velocity v is positive when s is increasing that is on the intervals 0 1 an...View the full answer

Answered By
Bhartendu Goyal
Professional, Experienced, and Expert tutor who will provide speedy and to-the-point solutions. I have been teaching students for 5 years now in different subjects and it's truly been one of the most rewarding experiences of my life. I have also done one-to-one tutoring with 100+ students and help them achieve great subject knowledge. I have expertise in computer subjects like C++, C, Java, and Python programming and other computer Science related fields. Many of my student's parents message me that your lessons improved their children's grades and this is the best only thing you want as a tea...
2+ Reviews
10+ Question Solved
Related Book For 

Calculus Early Transcendentals
ISBN: 9781337613927
9th Edition
Authors: James Stewart, Daniel K. Clegg, Saleem Watson, Lothar Redlin
Question Posted:
