

The graph of p in the figure has vertical asymptotes at x = -2 and x =
Question:
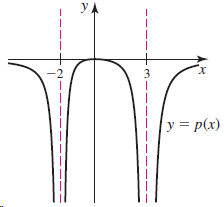
The graph of p in the figure has vertical asymptotes at x = -2 and x = 3. Analyze the following limits.
a. limx→-2- p(x)
b. limx→-2+ p(x)
c. limx→-2 p(x)
d. limx→3- p(x)
e. limx→3+ p(x)
f. limx→3 p(x)
Fantastic news! We've Found the answer you've been seeking!
Step by Step Answer:
a b ...View the full answer

Answered By
Ehsan Mahmood
I’ve earned Masters Degree in Business Studies and specialized in Accounts & Finance. Couple with this, I have earned BS Sociology from renowned institute of Pakistan. Moreover, I have humongous teaching experience at Graduate and Post-graduate level to Business and humanities students along with more than 7 years of teaching experience to my foreign students Online. I’m also professional writer and write for numerous academic journals pertaining to educational institutes periodically.
248+ Reviews
287+ Question Solved
Related Book For 

Calculus Early Transcendentals
ISBN: 978-0321947345
2nd edition
Authors: William L. Briggs, Lyle Cochran, Bernard Gillett
Question Posted:
