

The population of the United States (in millions) by decade is given in the table, where t
Question:
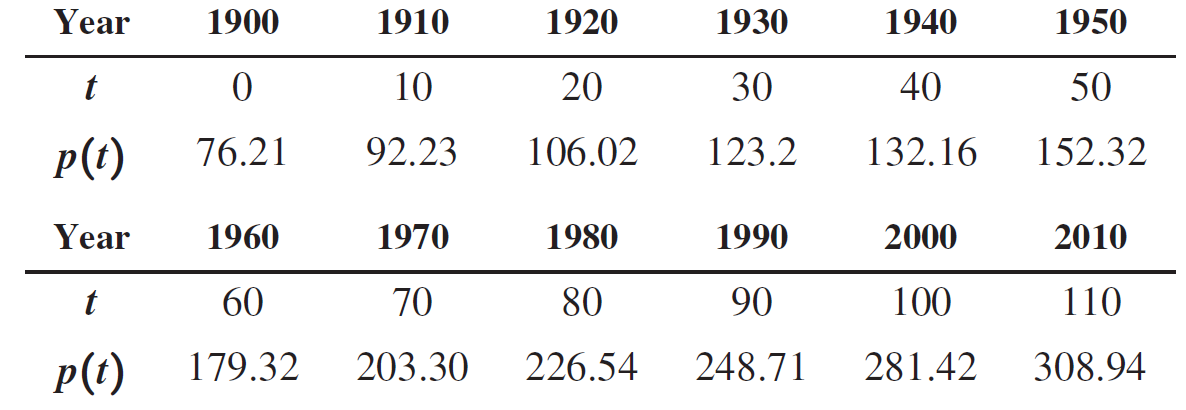
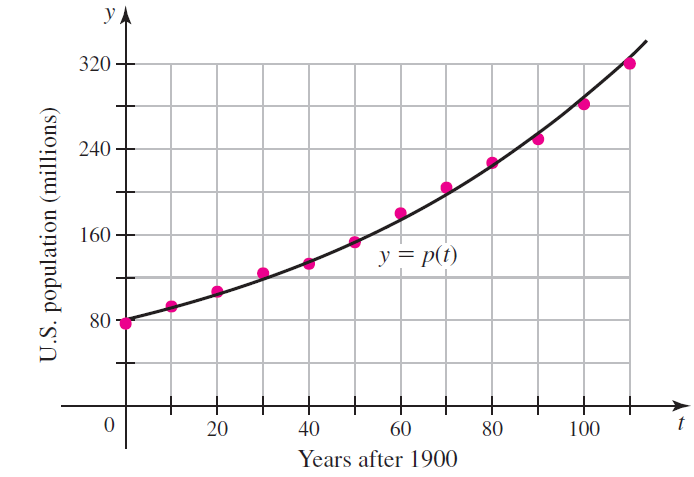
The population of the United States (in millions) by decade is given in the table, where t is the number of years after 1900. These data are plotted and fitted with a smooth curve y = p(t) in the figure.
a. Compute the average rate of population growth from 1950 to 1960.
b. Explain why the average rate of growth from 1950 to 1960 is a good approximation to the (instantaneous) rate of growth in 1955.
c. Estimate the instantaneous rate of growth in 1985.
Fantastic news! We've Found the answer you've been seeking!
Step by Step Answer:
a Average growth is million people per year b The curve is pretty straight b...View the full answer

Answered By
Deepak Pal
Hi there! Are you looking for a committed, reliable, and enthusiastic tutor? Well, teaching and learning are more of a second nature to me, having been raised by parents who are both teachers. I have done plenty of studying and lots of learning on many exciting and challenging topics. All these experiences have influenced my decision to take on the teaching role in various capacities. As a tutor, I am looking forward to getting to understand your needs and helping you achieve your academic goals. I'm highly flexible and contactable. I am available to work on short notice since I only prefer to work with very small and select groups of students. Areas of interest: Business, accounting, Project management, sociology, technology, computers, English, linguistics, media, philosophy, political science, statistics, data science, Excel, psychology, art, history, health education, gender studies, cultural studies, ethics, religion. I am also decent with math(s) & Programming. If you have a project you think I can take on, please feel welcome to invite me, and I'm going to check it out!
1+ Reviews
10+ Question Solved
Related Book For 

Calculus Early Transcendentals
ISBN: 978-0321947345
2nd edition
Authors: William L. Briggs, Lyle Cochran, Bernard Gillett
Question Posted:
