

The U.S. consumer price index (CPI) measures the cost of living based on a value of 100
Question:
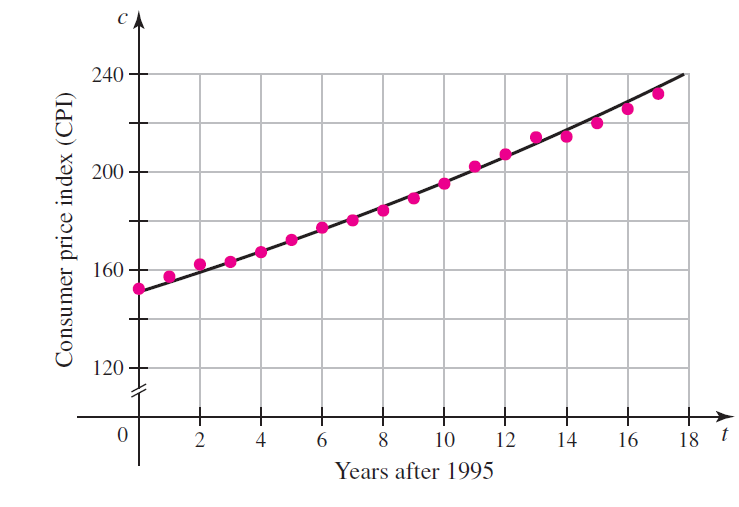
The U.S. consumer price index (CPI) measures the cost of living based on a value of 100 in the years 1982–1984. The CPI for the years 1995–2012 (see figure) is modeled by the function c(t) = 151e0.026t, where t represents years after 1995.
a. Was the average growth rate of the CPI greater between the years 1995 and 2000 or between 2005 and 2010?
b. Was the growth rate of the CPI greater in 2000 (t = 5) or 2005 (t = 10)?
c. Use a graphing utility to graph the growth rate, for 0 ≤ t ≤ 15. What does the graph tell you about growth in the cost of living during this time period?
Fantastic news! We've Found the answer you've been seeking!
Step by Step Answer:
a The average growth rate from 1995 to 2000 is Between 2005 and 2010 ...View the full answer

Answered By
Diane Joyce Pastorin
Please accept my enthusiastic application to solutioninn. I would love the opportunity to be a hardworking, passionate member of your tutoring program. As soon as I read the description of the program, I knew I was a well-qualified candidate for the position.
I have extensive tutoring experience in a variety of fields. I have tutored in English as well as Calculus. I have helped students learn to analyze literature, write essays, understand historical events, and graph parabolas. Your program requires that tutors be able to assist students in multiple subjects, and my experience would allow me to do just that.
You also state in your job posting that you require tutors that can work with students of all ages. As a summer camp counselor, I have experience working with preschool and kindergarten-age students. I have also tutored middle school students in reading, as well as college and high school students. Through these tutoring and counseling positions, I have learned how to best teach each age group.
2+ Reviews
10+ Question Solved
Related Book For 

Calculus Early Transcendentals
ISBN: 978-0321947345
2nd edition
Authors: William L. Briggs, Lyle Cochran, Bernard Gillett
Question Posted:
