

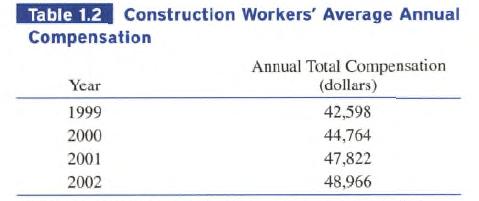
Table 1.2 shows the mean annual compensation of construction workers. (a) Find the linear regression equation for
Question:
Table 1.2 shows the mean annual compensation of construction workers.
(a) Find the linear regression equation for the data.
(b) Find the slope of the regression line. What does the slope represent?
(c) Superimpose the graph of the linear regression equation on a scatter plot of the data.
(d) Use the regression equation to predict the construction workers’ average annual compensation in the year 2008.
Fantastic news! We've Found the answer you've been seeking!
Step by Step Answer:
To find the linear regression equation for the data we need to find the values of the slope and yint...View the full answer

Answered By
Rodrigo Louie Rey
I started tutoring in college and have been doing it for about eight years now. I enjoy it because I love to help others learn and expand their understanding of the world. I thoroughly enjoy the "ah-ha" moments that my students have. Interests I enjoy hiking, kayaking, and spending time with my family and friends. Ideal Study Location I prefer to tutor in a quiet place so that my students can focus on what they are learning.
1+ Reviews
10+ Question Solved
Related Book For 
Calculus Graphical, Numerical, Algebraic
ISBN: 9780132014083
3rd Edition
Authors: Ross L. Finney, Franklin D. Demana, Bert K. Waits, Daniel Kennedy
Question Posted:
