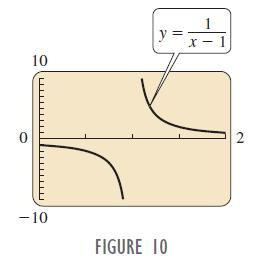
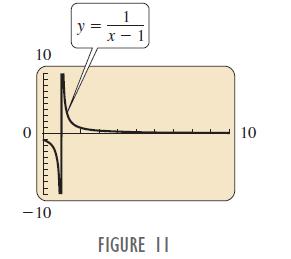
How can you tell that the graph in Figure 10 is more representative of the function f(x)
Question:
How can you tell that the graph in Figure 10 is more representative of the function f(x) = 1/(x – 1) than the graph in Figure 11?
Figure 10.

Figure 11.

Transcribed Image Text:
0 10 -10 FIGURE 10 1 2
Fantastic news! We've Found the answer you've been seeking!
Step by Step Answer:
Answer rating: 75% (8 reviews)
The given graph is y fx 1 x 1 As x 1 the denominator o...View the full answer

Answered By

Ankit Jangra
Career Summary: Over twenty five years of teaching experience, more than half of which in Engineering subjects and a significant half in MBA entrance level exams. Here is a short gist.
Work Experience: Alumni of a national institute of technology in computer science and an IIM (a prestigious management institute in India and globally) call getter (98.7 percentile).
Had also been a project guide on one occasion for a Engineering final year project in designing a Network Intrusion Detection System, an advanced firewall mechanism that dealt with network security. Have also designed many software projects from games to online payment to network data transfer format and interchange.
Have also written three university level text book notes on C and Data Structure, Digital circuits and Engineering Mathematics.
Had been teaching and mentoring MBA aspirants in reputed institutes of the country.
Associated with an academy for the last seven years teaching subjects like Aptitude, C and Data Structure, Analysis of Algorithm, Operating System, Digital Circuits for post graduate entrance exams and also had the privilege of being a guest lecturer in many government universities across the country.
Computer Literacy: Have detailed and intricate and extensive knowledge of Core Java, Enterprise Java, React, Spring Framework, Hibernate, LDAP (server directory structure) and Scala Actor System and Databases like MySql, Mongodb, PostgreSql. Teaching Java fundamentals from basic to advanced, from Java Memory model to Reference objects, to UTC Date Time format, to responsive Java, to design patterns, to JUnit test, to ForkJoin thread pool, only a few samples to count. Only recently, (for academic interest) designed a Json converter (Json to Java object and vice versa) from scratch like Jackson, for mongoDB application. Also designing web applications both front and backend, with knowledge of React, HTML, CSS, Javascript. Have been teaching Java for more than seven years.
0.00
0 Reviews
10+ Question Solved
Related Book For 

Calculus With Applications
ISBN: 9780321831101
10th Edition
Authors: Margaret L Lial, Raymond N Greenwell, Nathan P Ritchey
Question Posted:
Students also viewed these Mathematics questions
-
Figure EX-1.22 is a graph that appeared in USA Today (June 29, 2009). This graph is meant to be a bar graph of responses to the question shown in the graph. a. Is response to the question a...
-
The following additional information is available for the Dr. Ivan and Irene Incisor family from Chapters 1-5. Ivan's grandfather died and left a portfolio of municipal bonds. In 2012, they pay Ivan...
-
How can you tell that a system of linear equations has no solution by just looking at its reduced matrix?
-
Midwest Inc. is a medium-size company that has been in business for 20 years. The industry has become very competitive in the last few years, and Midwest has decided that it must grow if it is going...
-
Suppose that the specifications for a part (in inches) are 6.00 0.15, and that the taguchi loss function is estimated to be l(x) = 6,500(x-t)(squared). Determine the estimated loss if the quality...
-
Describe what you would look for in a reaction involving gases in order to predict the sign of So. Explain.
-
The maximum pressure ratio in single stage single cylinder reciprocating compressor is __________.
-
Matt's Music Inc. makes three musical instruments: trumpets, tubas, and trombones. The budgeted factory overhead cost is $188,000. Factory overhead is allocated to the three products on the basis of...
-
i need help with this question with an explanation thanks! 7) Large Co. pays its employees $20,000 gross salary each week. 30% of salary is withheld for income taxes and 5% is withheld to pay Social...
-
Use a graph of f(x) = e x to answer the following questions. a. Find b. Where does the function e x have a horizontal asymptote? lim e*. 00
-
Use the definition of the derivative to find the derivative of the following. y = 5x 2 6x + 7
-
Explain your answers, choose an exercise from among Exercises 3948 that you think is most easily solved by the indicated method. Determinants Data from Exercises 48 Solve the given systems of...
-
As a firm grows larger, ________-. a) economies of scale set in, then diseconomies of scale b) diseconomies of scale set in, then economies of scale c) economies of scale and diseconomies of scale...
-
The transcontinental railroads completed in the 1860s, 1870s, and 1880s all bypassed the ____. a) Northeast b) Midwest c) South d) mountain states e) Far West
-
The manager of the cost accounting department of a large computer manufacturing firm always tells three jokes during her monthly report to the board of directors in an attempt to inject a bit of...
-
A computer manufacturing firm accepts a shipment of CPU chips from its suppliers only if an inspection of 5 percent of the chips, randomly chosen from the shipment, does not contain any defective...
-
Each of the following is an example of capital except _____. a) land b) an office building c) a computer system d) a factory
-
Spam filters try to sort your e- mails, deciding which are real messages and which are unwanted. One method used is a point system. The filter reads each incoming e-mail and assigns points to the...
-
Which one of the following anhydrous chloride is not obtained on direct heating of its hydrated chloride? (A) BaCl2 (B) CaClz (C) MgCl2 (D) SrCl2
-
The table gives actual and projected year-end assets in Social Security trust funds, in trillions of current dollars, where Year represents the number of years since 2000. The polynomial function...
-
(a) For the function (x) = -4x 2 + 11x, find the value of (3), as well as the approximation using (b) Repeat part (a) using h = 0.01. (c) Repeat part (a) using the function (x) = -2/x and h = 0.1....
-
Officials in California tend to raise the sales tax in years in which the state faces a budget deficit and then cut the tax when the state has a surplus. The graph below shows the California state...
-
Compute the yield to maturity for a zero coupon bond with a maturity of 9 years and a face value of $1000. The bond is selling for $679.08. (Assume annual discounting.) (Round to 100th of a percent...
-
Determinants of Interest Rates Using the following DATA: R*= 1.7500% I 1 = 7.0000% I 2 = 5.0000% I 3?= 2.0000% MRP = .30% ( t - 1) (NOTE: This is a PERCENTAGE, not a DECIMAL MRP!) t = number of years...
-
Concrete Manufacturing Ltd is considering two alternative investment proposals. The first proposal calls for a major renovation of the company's manufacturing facility. The second involves replacing...

Study smarter with the SolutionInn App


