

In an introductory statistics course at Cornell University, 147 undergraduates were asked their own height and the
Question:
In an introductory statistics course at Cornell University, 147 undergraduates were asked their own height and the ideal height for their ideal spouse or partner. For this exercise, we are including the data for only a representative sample of 10 of the students, as given in the following table. All heights are in inches.
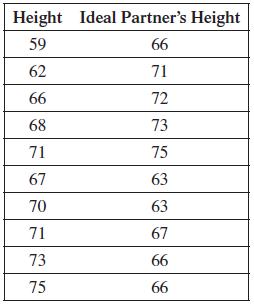
(a) Find the least squares line and correlation coefficient for these data. What strange phenomenon do you observe?
(b) The first five data pairs are for female students and the second five for male students. Find the least squares line and correlation coefficient for each set of data.
(c) Plot all the data on one graph, using different types of points to distinguish the data for the males and for the females. Using this plot and the results from part (b), explain the strange phenomenon that you observed in part (a).
Step by Step Answer:
a b c There is no linear relationship among all 10 data pairs However there is a linear relati...View the full answer


